There’s hardly anyone who doesn’t like visuals. Gantt charts incorporate complex information and turn it into an easy-to-read format that anyone in the team can understand by taking a quick glance. In this article, I’ll introduce you to the world of Gantt charts, their usability, and the top 10 software to create elegant Gantt charts. Let’s start!
What Is A Gantt Chart?
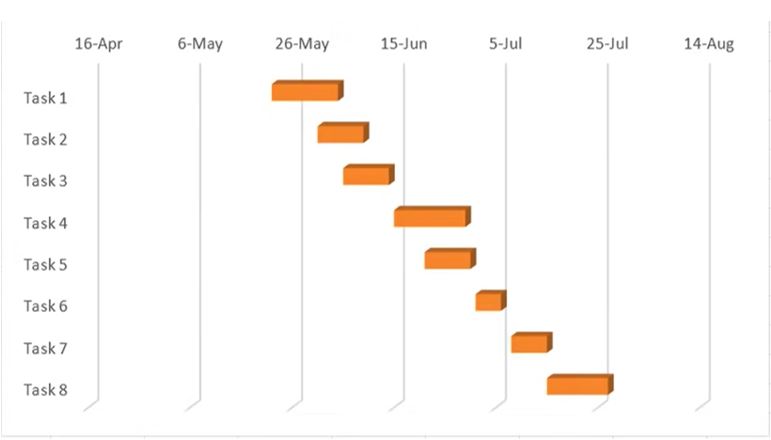
A Gantt chart is a visual representation of a project in the form of a horizontal bar chart. It helps you monitor, plan, and manage projects by illustrating work schedules, available resources, and task execution. In the 1910s, it was invented and popularized by Henry Laurence Gantt, a management consultant and mechanical engineer. Gantt charts showcase all the vital information about a project and keep people updated with the tasks, who is responsible for completing them, and the timeline. And the software used to create Gantt charts is called Gantt chart software. This is a valuable tool for project managers and their teams to help plan and ensure their projects are completed on time. Gantt charts help you visualize:
Project tasksProject timelineTask and project durationThe task orderRelationship between tasksAvailable resourcesPeople responsible for completing the task
Reading a Gantt chart is not tough; it includes multiple columns and rows with bars running horizontally. The bars also represent projects or tasks specified on the left-hand column. The bar length tells how far the task has reached compared to its schedule, while columns running parallel to the bars signify the timeline.
Features of Gantt Chart
Some of the features are:
Tasklist: You can find the task list on the chart’s left, vertically down. It explains all the tasks organized into subgroups and groups.Timelines: It shows the days, weeks, months, or years and runs across the chart’s top horizontally.Dateline: It’s a vertical line reflecting the current date.Dependencies: The lines connecting the lined-up tasks in a specified order.Bars: These are horizontal markers showing the tasks and their duration, start/end dates, and progress.Milestones: They display important dates, events, and deliverables.
Why Do You Need Gantt Charts?
Efficient Project Management
Gantt charts are handy for project management, from planning and task allocation to execution, monitoring, and tracking final delivery. You can use it to make project strategies based on the requirements, form your best team, and set dependencies, potential risks, and milestones. You can also define the timelines for each project and track their progress with the help of Gantt charts.
Clear Visual Representation
Gantt charts provide a clear task and project visibility to understand what’s happening and what must happen. It will also show you the task order, responsible team members to complete a task, and when a task must be completed in a way that’s easy to understand. From managers to team members, everyone can view the scheduled tasks and work accordingly to complete a project on time.
Optimal Resource and Time Management
With Gantt charts, resource and time management becomes more manageable. You can break a complex project into small tasks and small tasks into more minor details. In addition, you can overview your team members and assign tasks based on their capabilities to make the best use of their talents. You can also assign dates for individual tasks, so they can all add up to achieve the successful completion of the project.
Effective Communication
Gantt chart software can have a comment box that team members can use for updating the task progress. This way, everyone in the team can be on the same page to facilitate smooth task completion within the specified time. It minimizes friction and increases team effort, collaboration, and effective communication between managers, leaders, and team members.
Who Uses Gantt Charts?
Gantt charts find applications in various industries. Some of the sectors using Gantt charts are IT, manufacturing, construction, healthcare, education, event firms, human resources, marketing agencies, consulting firms, and design creatives. Executives and decision-makers can use this tool to plan, schedule, allocate, and execute tasks effectively. Some of the key users of Gantt charts are:
Project managersProduct managers and ownersCEOs and CTOsHR managersOperations managersMarketing managers
Now, let’s look at some of the best software for creating Gantt charts.
Monday.com
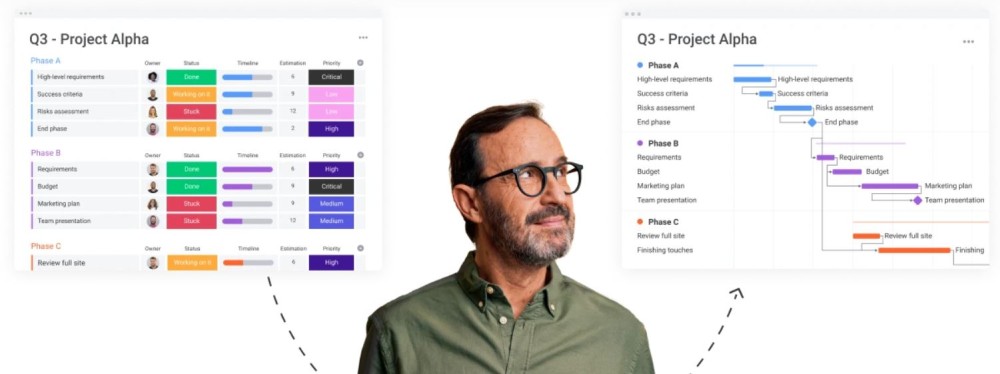
Create robust and beautiful Gantt charts for your projects to efficiently plan, execute, and track the projects with a flexible and visual platform of Monday.com. It allows you to manage tasks and capacity, track dependency and workload, monitor progress, plan a project and collaborate with the team. With Gantt charts, you can keep track of the milestones and never miss any deadline. Visualize milestones and important dates to set dependencies for the projects to ensure everything is going right and on time. Convert old-fashioned spreadsheets into intelligent boards and view them easily as Gantt charts. Plus, collaborate with your team to discuss the context of the work seamlessly using Gantt charts. Gantt charts let you transform your data to ensure the overall workflows run efficiently and smoothly. You can also receive real-time updates on every device to improve team engagement and collaboration instantly. In addition, Monday allows you to set up automation in no time to leave repetitive tasks and save time. Connect your business tools to Monday.com and experience a better workflow by having all the tools in a single place. Use Monday for free if you are an individual and get the necessary features to keep track of your work. Choose a plan that suits your business needs at $10/seat/month and take a free trial for the same plan.
ClickUp
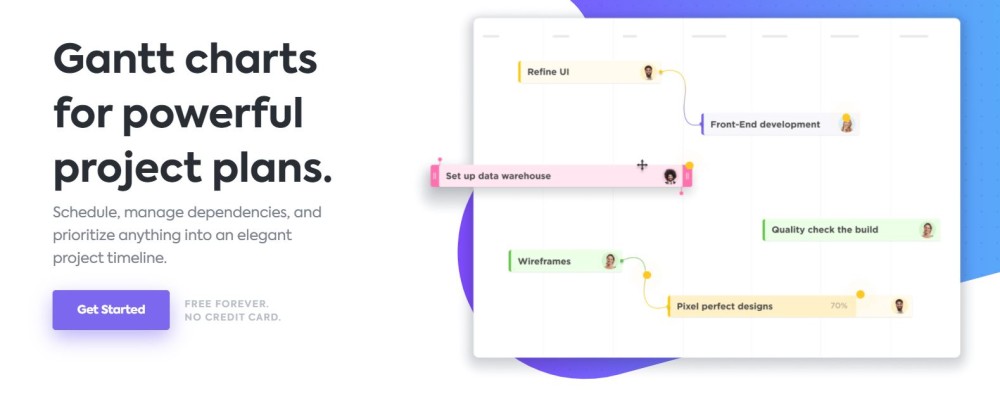
Manage dependencies, schedule tasks, and prioritize every task into a project timeline with ClickUp. The dynamic timeline allows you to track progress, handle bottlenecks, and manage deadlines. This chart gives you a complete view of all projects, tasks, lists, and spaces and lets you assign different colors to different tasks to know what is happening and where. Sort each task according to your prioritization and create cascading views in a single click to see the essential tasks one by one. Update your projects with simple drag and drop actions and share the details with your team along with the dynamic progress percentage. Make your work even simpler by linking the new tasks with dependencies so that whenever you drag a task with dependencies, you will automatically find rescheduled tasks in the chain. Discover dependency path tracking to know the potential bottlenecks to prevent inefficiencies. Get benefits of unlimited users, unlimited tasks, 100MB storage, and two-factor authentication in ClickUp’s free plan. If you are planning to have unlimited storage, the price will be $5/member/month.
Wrike
Turbocharge your project planning with the Gantt chart software – Wrike. Wrike creates online Gantt charts for you to make your work easier by managing projects more conveniently. Its interactive timelines help you view the progress of your project and keep your team on the same page. With the dynamic timeline, you will never miss any project progress, communication, or deadlines. Gantt chart gives you a complete view of dependencies and work scope. Smart critical path analysis allows you to spot bottlenecks that can cause inefficiencies in operations. You can control many projects from a single platform. In addition, update the project timelines with drag and drop action to collaborate with teams in real-time. In addition, you can import all your .MPX, .XML, and .MPP tasks into Wrike to have a simplified project experience. A Gantt chart allows you to oversee, adjust, and communicate about projects in a single space. With the complete visualization of the Gantt charts, you can understand what you are doing and how everything is related. In addition, you can share the snapshots of the progress with the team quickly and change deadlines and dates through drag and drop tasks. Wrike’s project scheduler’s dynamic timeline adjusts everything automatically that connects with your changes. Whenever you add assignees, project duration, and dates, team members will be notified instantly. And all the adjustments will be shared with your team automatically. Start sharing tasks with your team efficiently by scheduling software using a link, and they also allow taking a hard copy of the Gantt chart. Wrike offers a free version of the Gantt chart for unlimited users and 2GB storage space per account. The pricing for professional service is $9.80/user/month.
Smartsheet
Try quick and straightforward online Gantt chart software Smartsheet to make your work life easier. This online task planning and execution platform allows you to create Gantt charts for work management and project needs. It gives you a familiar and easy-to-use spreadsheet interface so you can create Gantt charts quickly with some clicks. You can integrate Smartsheet with your business tools to offer you a better experience while working. Create a single central location of the project details and share the work with external stakeholders and internal teams by attaching information and files in the context of the Gantt chart. Give the power to your team to manage work from the comfort of their place and at any time. Additionally, roll up the Gantt chart into the dashboard to view the project status in real-time. The tool also improves your productivity and saves time to help you focus on critical tasks. You will get everything you expect in an online Gantt chart tool such as drag-drop Gantt bars, organize tasks, schedule tasks, adjust Gantt colors, set dependencies, change column types, set reminders, identify critical paths, store files, assign tasks, track milestones, export your work, manage resources, and many more. The price starts from $7/user/month, and you can try the software for free.
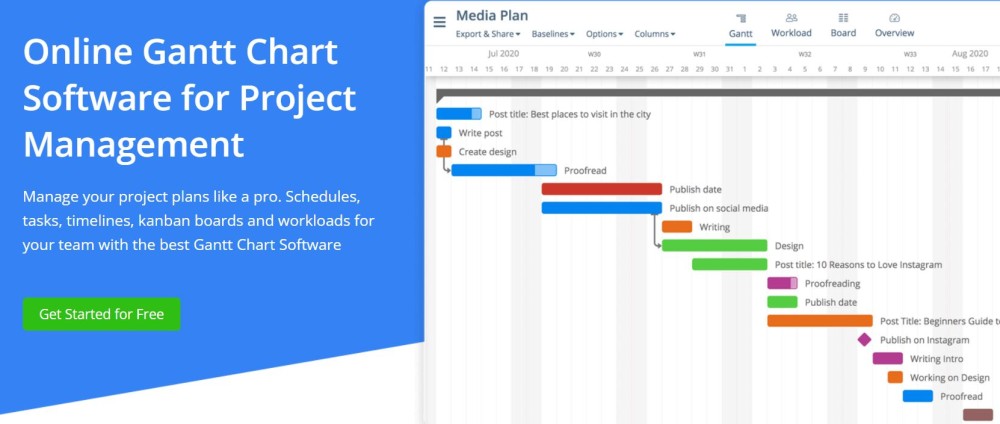
Instagantt
Manage your team’s schedules, timelines, workloads, kanban boards, and tasks with the online Gantt chart software – Instagantt. It allows you to schedule your project, set dependencies, keep track of the baselines, and know your team’s workload. Create professional Gantt charts within minutes with the drag and drop feature. Align your work with the dependencies to know which task comes before and keep track of the rest to prevent delays in completing the project. In addition, always keep track of your team to see what every member is working on at a particular time to balance your team. Maintain a balanced and realistic workload across the team and project to improve progress. Summarize the details of your projects in the dashboards so that your team finds it easy to see what they want by saving their time. The graph will show you the progress curve over time so that every member can keep track of the progress. A single subscription will cost you $7/month, and the team subscription will cost you $5/user/month. Take a 7-days free trial with the subscription plan you select.
TeamGantt
Create online Gantt charts for your team with TeamGantt and invite members to collaborate on the project or Gantt chart plan. Switch between Gantt chart and other project views easily with some clicks and use the simple drag and drop option to make your work easy while creating Gantt charts. TeamGantt lets you keep your documents, conversations, and tasks in a single place so that you and your team can access the details anytime you want. Check the availability of your team before assigning and scheduling any tasks. You can also track who is busy, what project they are working on, who is out the radar from the online Gantt chart. Be productive while working remotely by keeping teams updated. Get tools and features like beautiful proposals with Excel reports, the option to create multiple projects in a single Gantt chart, tracking dependencies between tasks, storing project files, checking progress, time tracking, and more. If you are an individual working on a single project, go with the free plan with limited and necessary features. Manage multiple projects with a more extensive plan of $24.95/month and avail yourself of the 30-day free trial.
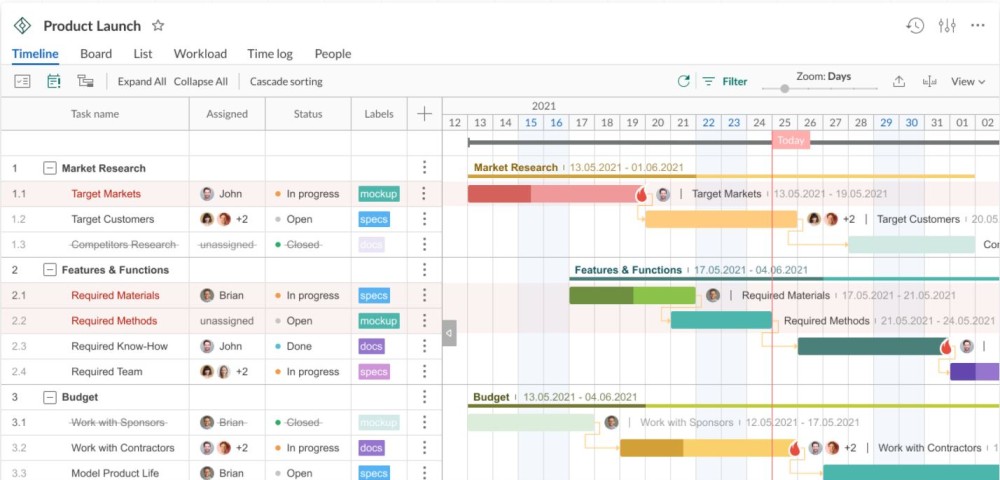
GanttPRO
Keep your planning concrete and engage your team members in it using GanttPRO that allows creating online Gantt charts from the information you have by the simple drag-and-drop tool. Use this interactive online Gantt chart maker to plan and control multiple projects at a single time. You can split the projects into milestones, tasks, and sub-tasks and organize tasks, set durations, due dates, and dependencies. Furthermore, create an online Gantt chart to set precise estimates and manage the resources wisely. You will get structured project plans online, the options to schedule your project, drag-drop simplicity, and the capability to prioritize every task to improve productivity. Besides, experience features like workload management, custom working days, board view, notifications, comments, attachments, critical path, auto-scheduling, time log, report, export, and share files. Its pricing starts from $8.90/user/month for unlimited functionality for effective team collaboration.
Project Central
Project Central ensures your project stays on track so that your team can finish it within the deadline. Create an online Gantt chart to get a clear view of the project’s timeline, remaining tasks that need to be completed within a period, and how your team is performing in each task. You can organize as well as prioritize tasks to meet deadlines by enhancing work efficiency. Adjust the task period by dragging the dates or moving the task to keep the whole project in line. Gantt charts will help you in planning, scheduling, and managing the tasks and your team. Update any task information you want at any time from the tasks panel. Sign up for a 14-day free trial to try scheduling and managing projects. Manage unlimited projects and team members at just $49/month.
Gantt Excel
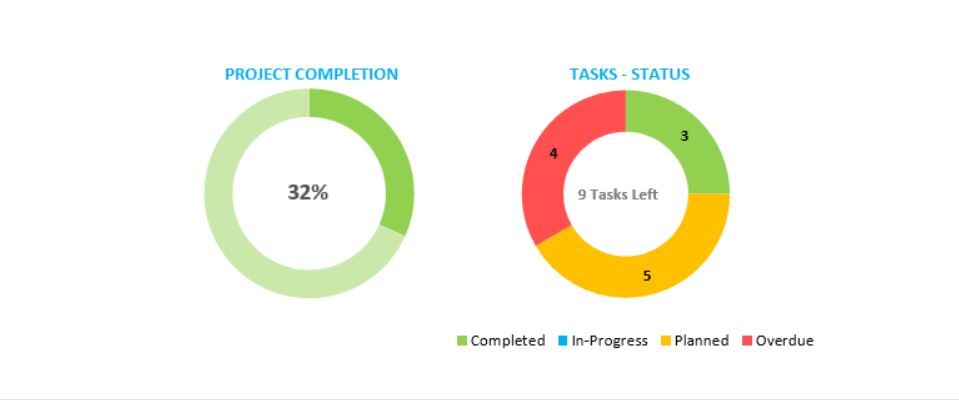
Get a free Gantt Excel template to create professional-looking Gantt charts in Excel. Gantt Excel template is super easy-to-use and completely automated. If you have Microsoft Excel, download Gantt Excel and create charts with ease. Gantt Excel provides you with a clear view of every step in the project from start to end. Create tasks with Gantt Excel and link them using dependencies to track your team’s progress against milestones and deadlines. It will also customize the Excel Ribbon to input Gantt Menu and buttons to add tasks, milestones, Gantt charts, etc. In addition, you can schedule your tasks based on the hours or days to plan everything. Create cascading task dependencies inside the Gantt chart based on time to see how changes in time will affect the final deliverable and other parts of the processes. Gantt Excel’s in-built scheduling automation of the template helps update the dates that depend on the tasks. Moreover, it makes your work even more effortless by introducing a project dashboard add-on. You can easily communicate with your team with the available information regarding projects. According to your input and project timeline, the project dashboard will be created instantly by analyzing your project plan. Get milestones, task progress indicators, resource modules, intuitive forms, highlighting overdue tasks, and many more options with Gantt Excel software. Plus, you can add a cost module to track project costs in your chart.
ProofHub
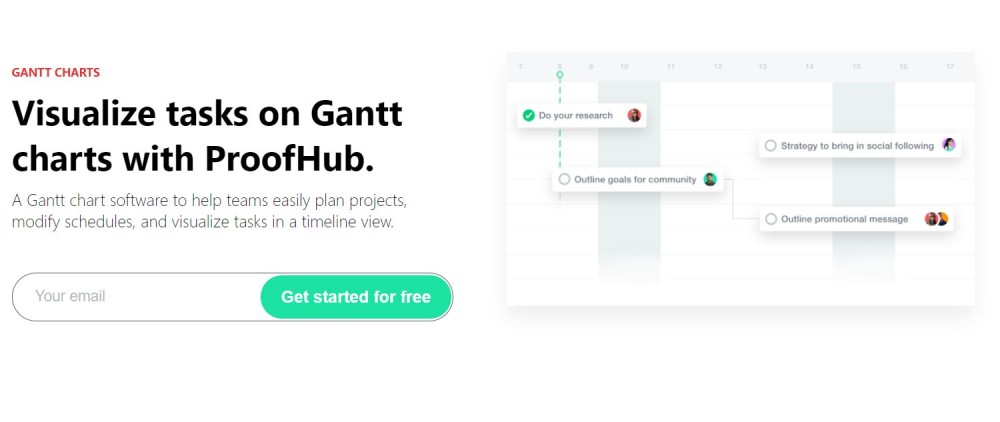
Visualize your tasks on Gantt charts with ProofHub. It helps your team to plan projects and modify schedules in a timeline view. You can set dependencies for each task, highlight critical paths, track progress, associate milestones, export Gantt charts, print, and more from a single place. Schedule and prioritize in an order according to your plan and let your team view every detail. You can assign tasks to your team by maintaining a balanced workload between them for better productivity. Additionally, the tool allows you to mark key dates like completion dates, etc., and review meetings over the project plan. You can also track the progress with a percentage view and picture the ongoing tasks. Limit the task visibility to the members involved, change dates, schedule tasks, and use the drag and drop tool to shift deadlines. You can also highlight critical paths to check the effects of work on the dates. In addition, you can export and print Gantt charts to use in your meetings or keep them as a record. Email-in helps you sync your tasks from your email in the Gantt chart, and you can import task lists from CSV files to avoid starting over. From Gantt data to the progress of the tasks, view everything in one place. Get up to 40 projects, 15 GB storage, and unlimited users for $45/month. Start your free trial to experience the features.
Conclusion 👨💼
I hope this information on Gantt charts and the top software to create them helps you choose the right one based on your requirements and budget.
